Monday, May 11, 2020

Final Report


Introduction


In the last week of classes, we are happy to present our final report! In this report, we discuss our final yo-yo design and its associated critical dimensions, a detailed simulation of our factory layout, and an in-depth cost analysis of our yo-yo production at the factory level. Additionally, we take a look at how we might scale to 100x production. Finally, we reflect our yo-yo project on what we learned this semester.


A full version of our final report can be found here.

Yo-Yo Design Overview


The final design of our yo-yo consists of a thermoformed "glass cup" filled with an injection molded liquid bottom and an injection molded liquid cap, tastefully garnished with an injection molded lime. Below are snapshots of each component of our yo-yo, along with brief descriptions.

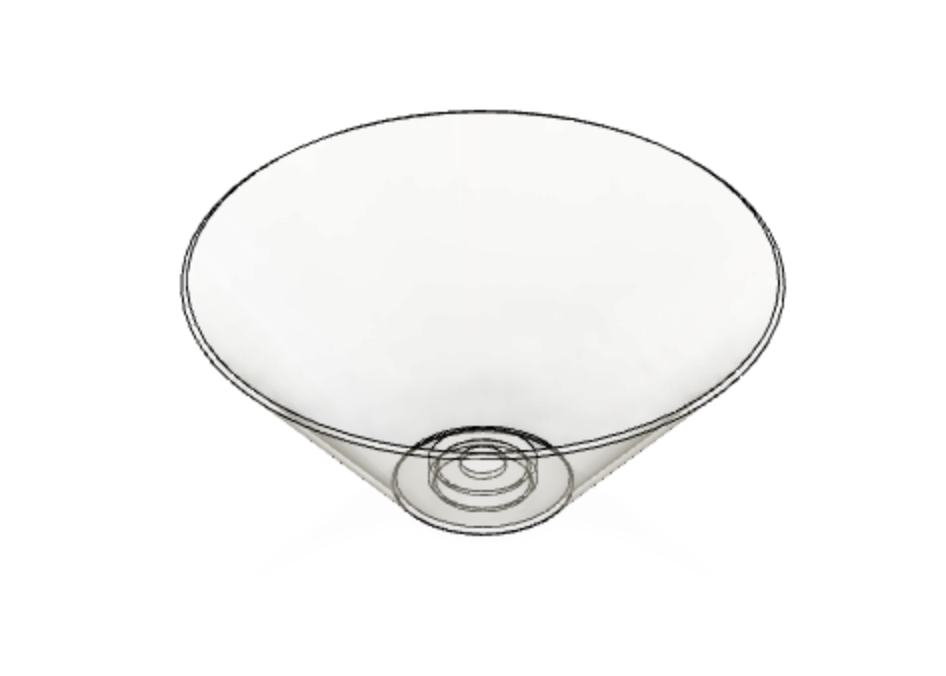
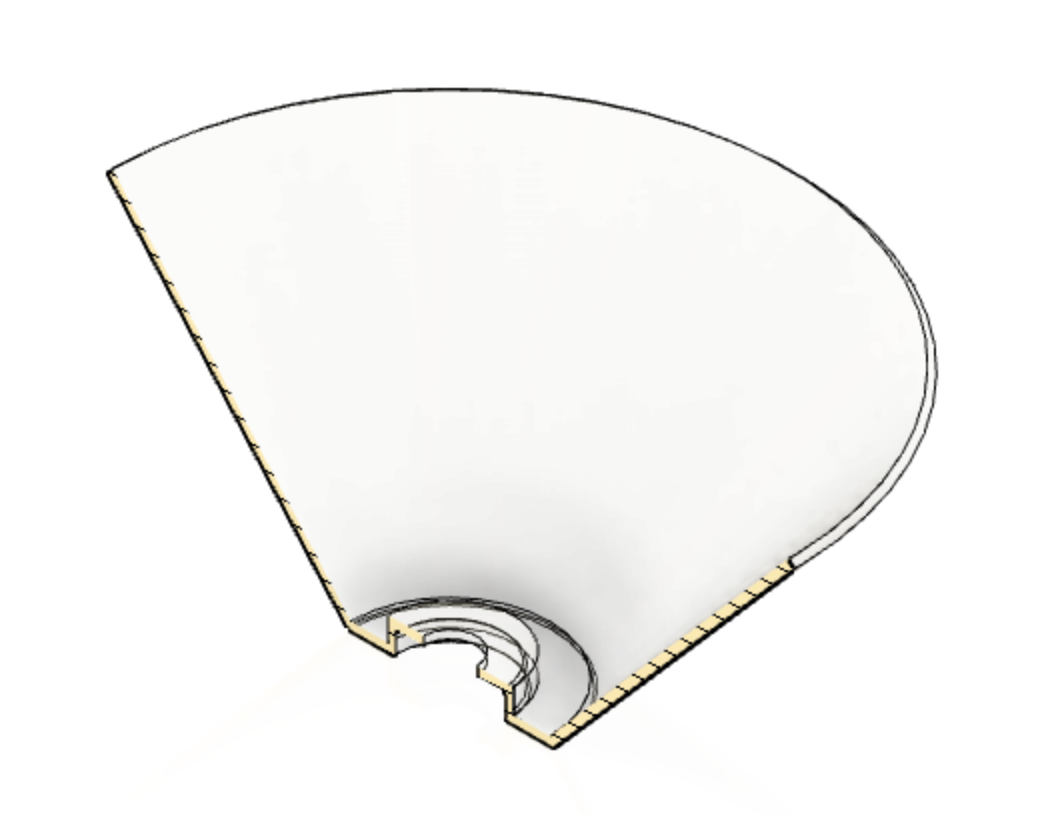
Our cocktail begins with a thermoformed exterior, which we call the glass.


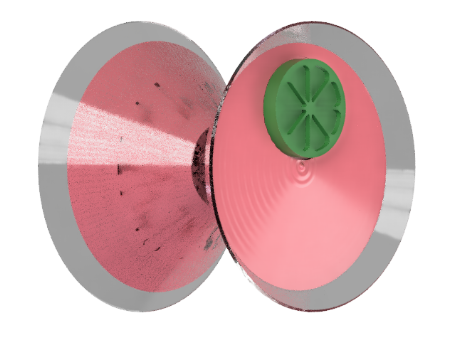
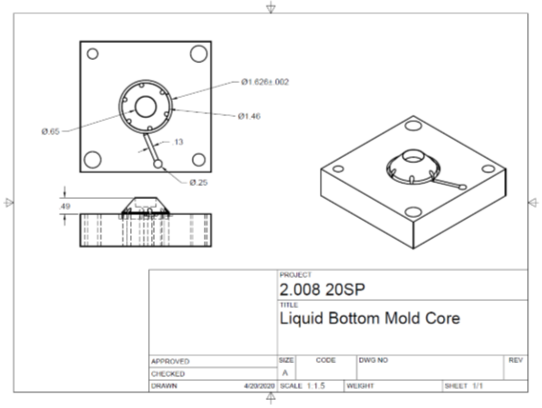
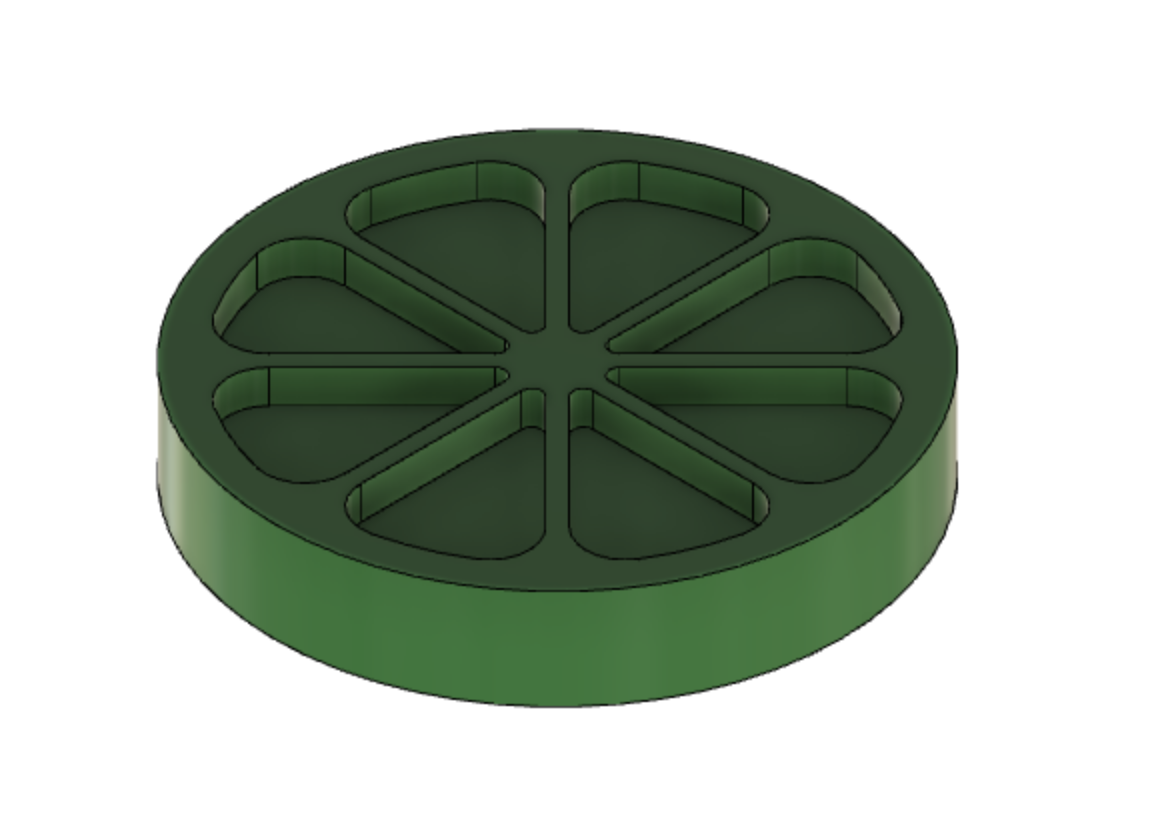
The liquid bottom has a critical dimension where it press-fits with the liquid cap. The nut is overmolded, which is essential to the assembly of our yo-yo. The two halves can later be screwed together.


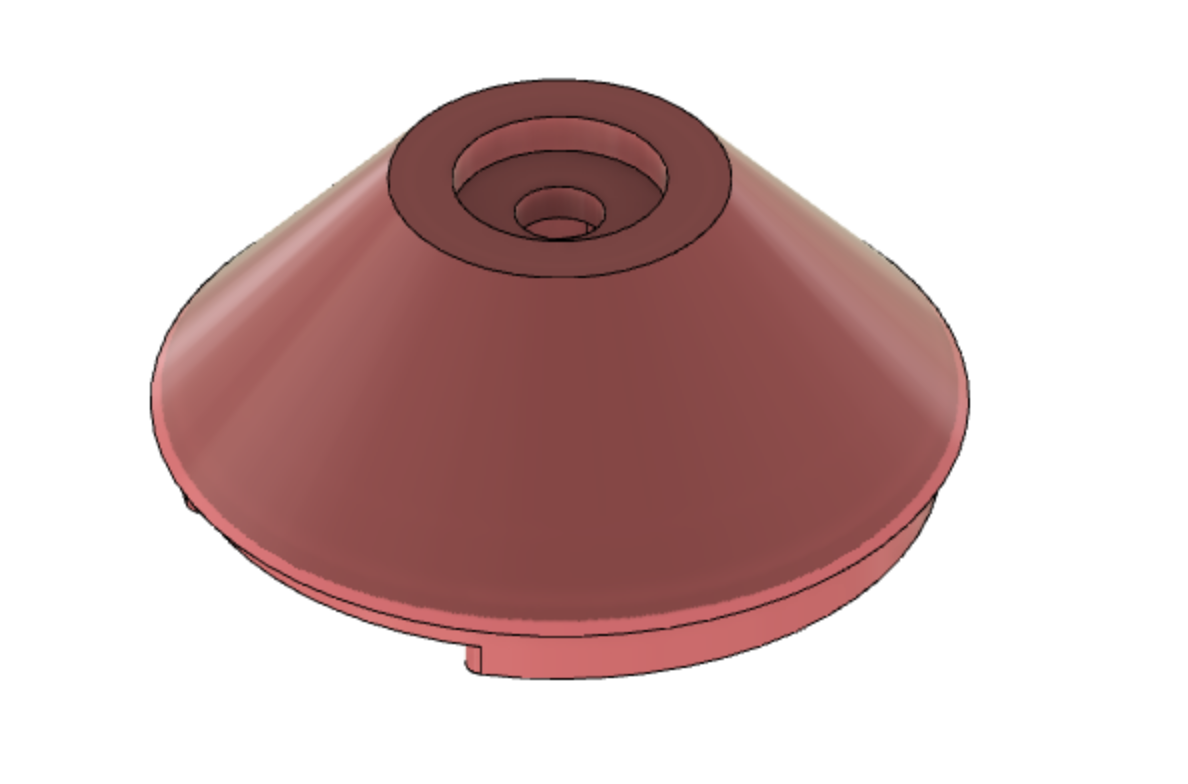
The liquid cap has two critical dimensions, which are the press-fit locations for the lime and for the liquid bottom.


Finally, the lime has a critical dimension where it presses into the liquid cap.


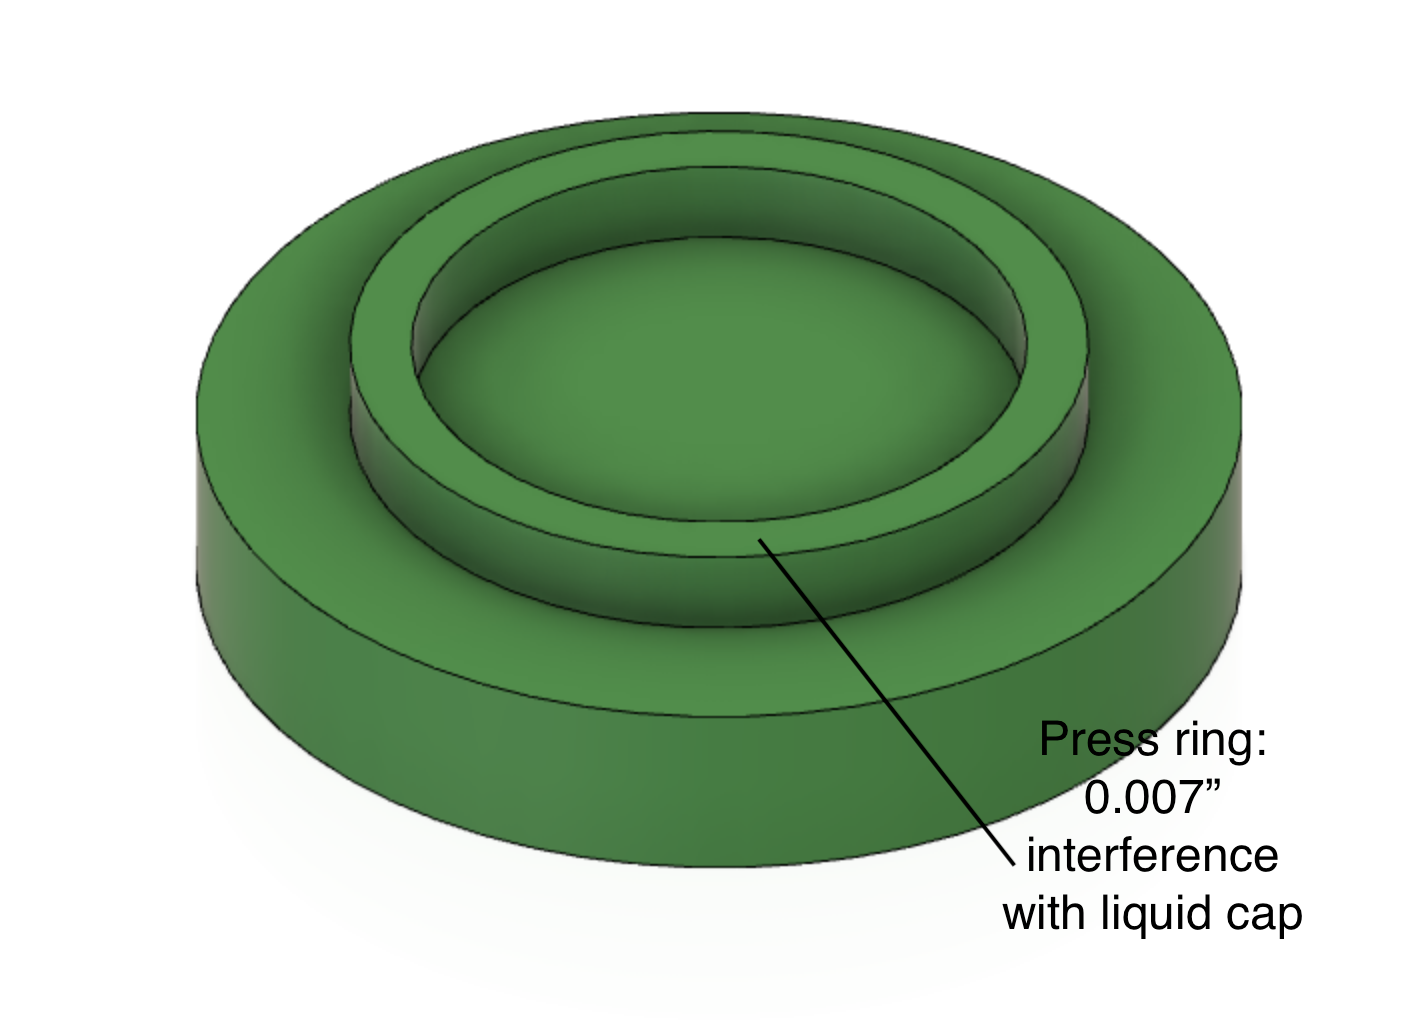
The chart below gives the nominal dimensions and tolerances associated with the press-fits described above.

#
Dimension
Nominal Value (in)
3-sigma Tolerance (in)
1
Liquid Bottom to Liquid Top:
press-fit outside diameter
1.605”
±0.007”
2
Liquid Top to Liquid Bottom:
press-fit inside diameter
1.595”
±0.007”
3
Liquid Top to Lime:
press-fit inside diameter
0.594”
±0.002”
4
Lime to Liquid Top:
press-fit outside diameter
0.600”
±0.002”

Manufacturing and Assembly


The image below is a screenshot of our factory layout.


Our factory starts with four production lines for the four main components of our yoyo. Next, each yo-yo half is assembled concurrently at the Half Assembly stations. One half is sent to the Center Assembly station where a worker puts in the spacer and screw. Finally, both halves are sent to the Final Assembly station where the string is attached and the yo-yo is screwed together and sent out for shipping.


Cost Analysis


Building a factory in China provides significant cost savings compared to the United States, making China the obvious choice for building our factory. The savings from labor costs outweigh the increased shipping costs of finished yo-yos from China. We would also like to note that to address ethical concerns, we used an estimated living wage for the Chinese labor rate as opposed to a national average wage for factory workers.


United States
China
Cost of Production
Total injection molding cost ($)
651,580.45
101,370.69
Total thermoforming cost ($)
58,389.41
52,336.03
Total other material cost ($)
20,400.00
20,400.00
Total assembly cost ($)
187,563.00
44,313.00
Total shipping cost ($)
17,520.00
40,032.00
Estimated overhead ($) [1]
224,508.69
62,028.41
Subtotal cost of production ($)
1,159,961.55
320,480.14
Cost per Yo-yo
Total yo-yos produced
1,000,000.00
1,000,000.00
Injection molding cost per yo-yo ($)
0.65
0.10
Thermoforming cost per yo-yo ($)
0.06
0.05
Other material cost per yo-yo ($)
0.02
0.02
Assembly cost per yo-yo ($)
0.19
0.04
Shipping cost per yo-yo ($)
0.02
0.04
Estimated overhead per yo-yo ($)
0.22
0.06
Subtotal cost per yo-yo ($)
1.16
0.32
Upfront Costs
Cost of IM machines ($)
72,500.00
72,500.00
Cost of TF machines ($)
67,000.00
67,000.00
Cost of die cutting machines ($)
10,000.00
10,000.00
Cost of assembly equipment ($)
63.00
63.00
Building cost ($) [2]
260,000.00
260,000.00
Subtotal upfront costs ($)
409,563.00
409,563.00
Subtotal upfront cost per yo-yo ($)
0.409563
0.409563
Grand Total ($)
1,569,524.55
730,043.14
Grand Total Per Yo-Yo ($)
1.57
0.73


Scaling to 100x Production


If we were to scale to 100x our production target, we would be able to reduce our unit cost to 32% in the US, 36% in China, and 17% if we were to move from the US to China. We find that materials, assembly, and shipping scale roughly 1:1 with production rate at this level. A switch from the United States to China would provide significant savings due to lower labor rates. Other cost savings could come from switching to 8-cavity molds and switching to a roll-fed thermoforming machine.


Reflections


This project was a valuable lesson for the entire team, and we gained firsthand experience on the manufacturing process. We learned how to design for manufacturing, and we learned firsthand how to machine molds, as well as thermoform and injection mold parts. The first few lab sections consisted of designing and machining a mold in order to create a thermoformed part. We found this to be a very helpful system because even before we began designing our yo-yo, we learned the intricacies of thermoforming. This new skill gave us more insight in how to design for manufacturing, and we kept our experience in mind when it came time to design the thermoformed part of our yo-yo.

In the second half of the semester, our team was dispersed across several states. In this new arrangement, our team adapted and continued to move forward in the development of our cocktail yo-yo. While we did get to see how the injection molding machines worked, we did not have the time to machine our own molds or injection mold our own parts. However, we were able to use new software to overcome this obstacle. Using Moldflow, we were able to simulate the injection molding of all of our injection molded parts. This allowed us to learn a lot from the simulations without having to spend time machining molds. We used the analysis in the software to adjust for shrinkage and to modify our designs to reduce defects. Even if we had been able to use the lab resources, this software would still have been very useful. It saves both time and material, because the learnings from the analyses would prevent us from iterating through molds to obtain critical dimensions within tolerance after shrinkage.

While we are disappointed to not have had the opportunity to physically manufacture our yo-yo’s during the course of the semester, we hope that someday one of us might be able to come back and make a few.


Thursday, April 30, 2020

Go-to-Manufacturing Report

Introduction

Last week we submitted out Go-to-Manufacturing Report. In this report we dive into detailed analyses of out injection molded parts using Autodesk Moldflow simulation. Detailed drawings of necessary tooling are included. We also take a first pass at estimating several operational parameters necessary for producing yo-yos at a scale of 1 million per year. Finally, a simplifies schematic of a factory layout in included to visualize the space requirements for this operation.

You should be able to find the complete GTM Report here.

Yo-Yo Design Overview

The final design of our yo-yo includes a plastic cup exterior, filled with swirling liquid and garnished with a lime, designed to mimic a Cosmopolitan cocktail.
The yo-yo features three injection molded pieces and one thermoformed piece, as well as two press-fits. The exploded view and section view below label the components and how they interact with each other.


Moldflow Analysis

We used Moldflow to calculate the process and geometric parameters that would allow us to achieve the optimal combination of rate, cost, and quality for our injection molded parts. All analysis was conducted assuming the use of polypropylene material with a 392° F injection temperature, 68° F mold temperature, and a maximum injection pressure of 37000 psi, corresponding to the capabilities of the BOY-22A. Some examples of our results are shown below. 

Design Changes

Based on Moldflow analysis as well as mold design considerations, we modified the injection molded part geometries to achieve the highest chance of producing high-quality parts which will fit together properly. Our changes are summarized as follows:

General


  • Scaled up parts based on estimated shrinkage when designing molds
  • Added tolerances for interference fits based on part size and capability of milling machines
  • Left tolerances low wherever possible (aesthetic parameters) 

Lime


  • Hollowed out inside of press fit to promote more uniform cooling 

Liquid


  • Added draft angles on inside of liquid bottom
  • Considered alternative ripple designs for liquid top but kept original design-based mold-making feasibility
  • Added filets to sharp corners on the liquid top to comply with smallest tool diameter
  • Changed thicknesses on certain areas to comply with smallest tool diameter


Material Selection

A summary of our materials choices is shown below. 

String

50/50 blend of cotton and polyester for high friction, durability, and comfortable feel. 

Glass

HDPE was selected because of its very high strength and clear glass-like finish. PETG was considered but is brittle especially at thinned locations such as the one in the yo-yo. 

Liquid Bottom/Top/Lime

The injection molded parts will be made from polypropylene. Polypropylene is inexpensive and resistant to impact forces. Additionally, it works well with snap fitting such as in snap-over lids. Other materials were considered such as ABS, polycarbonate, ABS/PC, polyamides, acrylic and polyoxymethylene. 

Bill of Materials


Tooling

We created drawings for the tooling used to create our yo-yos. Each tooling is designed to be manufactured from aluminum stock on the TRAK milling machine. The tooling includes the Glass Die, Liquid Bottom Mold Core, Liquid Bottom Mold Cavity, Liquid Cap Mold Core, Liquid Cap Mold Cavity, Lime Mold Core, and Lime Mold Cavity. The Glass Die is the tooling for our thermoformed part, and the remaining molds are for injection molded parts of our yo-yos.

For the lime mold, we needed to create a custom tool based of commercially available end mills. The narrow slots require low cutting forces and a long cycle time to ensure good finishing. We went with a 0.020" flat end mill which had a length of 0.75". Though this tool is very long, we minimized deflection by reduction the amount of material removed with each revolution. The finishing passes are done with a separate tool of equivalent size to ensure high quality surfaces. 

Some examples of tooling drawing are shown below.


Production

The following table shows several of our underlying assumptions and resulting operational requirements in order to fill a production demand of 1 million yo-yos per year. 

Molding Cycle Times

A key driving factor in how our production rate is the cycle time of each injection molding operation. The following table and donut charts show cycle times for each injection molded part and their respective breakdowns. 


Injection Molding Cost Estimates

Detailed cost estimates are listed in the table below. They are organized by material cost, mold cost, molding cost, total cost, and total cost per shot. 

Thermoforming Cost Estimates

Industry experts advised our team to contract out the thermoforming process since we could realistically achieve production rates an order of magnitude greater than what we can achieve with our injection molding process. To avoid investing in equipment that will run for one or two months a year and remain idle for the rest of the time, we will be contracting out the thermoforming production of our plastic glass parts. 

Innovative Plastics quoted us a price of $50,000 to deliver 2 million plastic glass pieces made of 0.030” HDPE. They told us that they could fill our order in two months. 

Total Costs

Factory Layout

Based on our calculations, we can up with a simplified schematic of what a factory floorplan might look like. 


Final Report

Introduction In the last week of classes, we are happy to present our final report! In this report, we discuss our final yo-yo design an...